
4 x 100
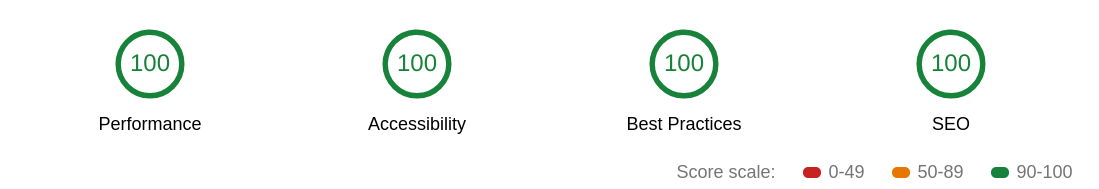
Isn’t this a beautiful sight 😍.
This screenshot is from the Lighthouse audit result for my webpage.
Lighthouse is an amazing tool for quickly auditing the performance of a website.
It may give you useful hints when trying to find the performance bottlenecks in loading a webpage.
However, the results are not absolute and they should be taken with a grain of salt.
Yet, I think everyone agrees seeing a score of 4 times 100/100 feels good.
And, as the most important measurement of performance, my site feels fast to use even on mobile devices and slower connections.
How Browsers Render Webpages
In order to understand what typically slows down a website’s loading performance, we need to understand the basics of what happens when navigating to a website using a web browser. The following explanation will be a simplified version of reality in order to keep the blog post relatively short and easy to read. Additionally, I do not understand everything that happens in between navigating to a URL and a fully loaded and rendered web page showing on the screen.
The Client-Server Architecture of the Web
The World Wide Web is based on the client-server architecture. Typically, the client refers to a web browser and the server is returning the HTML documents and other resources when clients request them.
The figure below shows a simplified version of what happens when a user accesses a traditional server rendered webpage. Only a successful case is covered in this example.
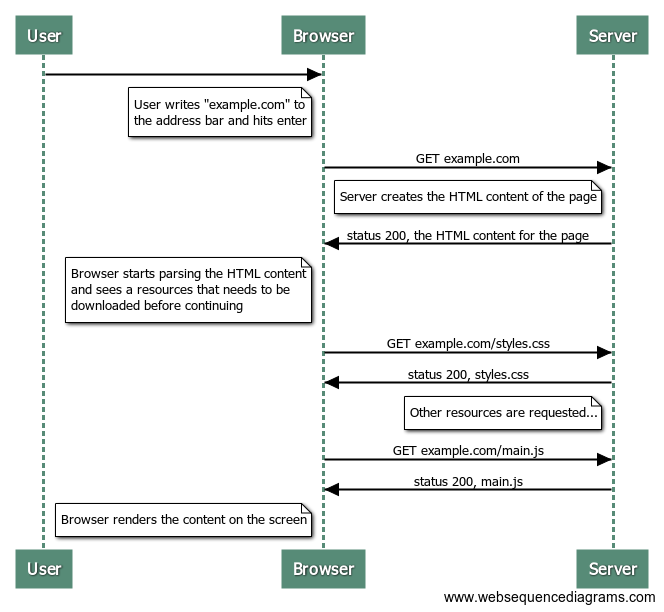
First, the user opens a web browser and types in the address or clicks a link on a webpage.
The browser will then do a DNS lookup for the address in order to find the server’s IP address.
In case of HTTPS websites, the browser and the server will do a TLS handshake in order to establish a secure connection.
The browser will then send a HTTP GET request to the server, which the address points to.
The server will return the HTML file for that webpage.
When the browser receives the response, it starts parsing it and may notice resources that need to be downloaded, such as styles.css and main.js in the above example.
The browser will then send HTTP requests for those resources and stop everything else while waiting for the results.
Finally, as early as possible, the webpage content will be rendered on the user’s screen.
Critical Rendering Path
The above mentioned steps before a webpage is rendered are commonly referred to as the Critical Rendering Path. It consists of the steps required before the browser is able to display the contents of the webpage on your screen.
Simplified version can be understood by looking at the following visualization by Luis Vieira:

Image source: Understanding the critical rendering path, rendering pages in 1 second.
CSSOM in the image refers to the CSS Object Model and DOM to the Document Object Model. As the visualization nicely shows, the browser has to rebuild the DOM and when it receives CSS, or synchronous JavaScript. This is due to the fact that CSS and JS can change the DOM structure and styles.
Browser vendors are doing a great job in optimizing the rendering. Lookahead pre-parser quickly scans the document for external resources, and tries to fire the most important requests with high priority. Additionally, developers are able to give priority hints to the browser in order to help it prioritize critical resources for improved loading performance.
However, most of the time, developers can also do more by reducing the amount and the duration of the required steps in the Critical Rendering Path.
Common Causes of Slow Webpages
Here is a list of the most common causes for slow webpages:
- Render blocking resources:
- External CSS, browser needs to stop rendering and wait for them to arrive
- Similarly, (web) fonts may be render blocking if an effective font-loading strategy is not used
- JavaScript, because it has to be executed before rendering due to the fact that JS can change the contents in DOM and
- Analytics etc.
- Advertisement libraries
- Huge asset sizes
- Oversized and unoptimized images
- No CDN used
- Ineffective caching
- Slow backends
The list is not complete, and not a scientific result, rather a representation of how I feel about the topic. But as you can see, I put the slow backends as last on the list. In my experience backend is typically not the bottleneck, but rather the frontend is.
Why My Webpage is Blazing Fast
There are multiple factors that make my website super fast. Please note, that all of the methods I used for performance optimizations may not be suitable for larger projects.
Facts contributing to a blazing fast experience on my webpage:
- The site is fairly simple and small, not many images or other heavy content
- No analytics, advertisement libraries or tracking
- In fact, at one point I did not have any JavaScript resources
- Small amount of CSS
- Critical CSS is inlined in the HTML, which is a good idea for achieving a fast First Paint experience
- In my case, all the CSS is inlined
- The HTML size remains still small:
3.8 KBGZIPed - Small size is crucial for achieving a fast experience on mobile
- Optimized and small images using squoosh.app
- However, I only optimize the images on the first page, not the additional images that are in the blog posts
- Should probably automate the process somehow
- Typically I’m able to get ~60% smaller image sizes without losing too much visual information, that the human eye can see
- Cloudflare used as a CDN, and minimizes assets
- read more about my blog setup here
- Pages are prefetched for faster subsequent page loads
- When navigating to another page, the page contents are already available in the cache
- I use Quicklink to do this for me automatically
- My Quicklink usage can be seen in the bottom of the page and it looks like this:
<script src="/js/quicklink.js" defer></script>
<script>
  window.addEventListener('load', () => {
    const links = [...document.getElementsByTagName('a')].filter((a) => {
      return (
        a.hostname === window.location.hostname &&
        a.getAttribute('href') !== window.location.pathname
      );
    });
    quicklink({ urls: links });
  });
</script>
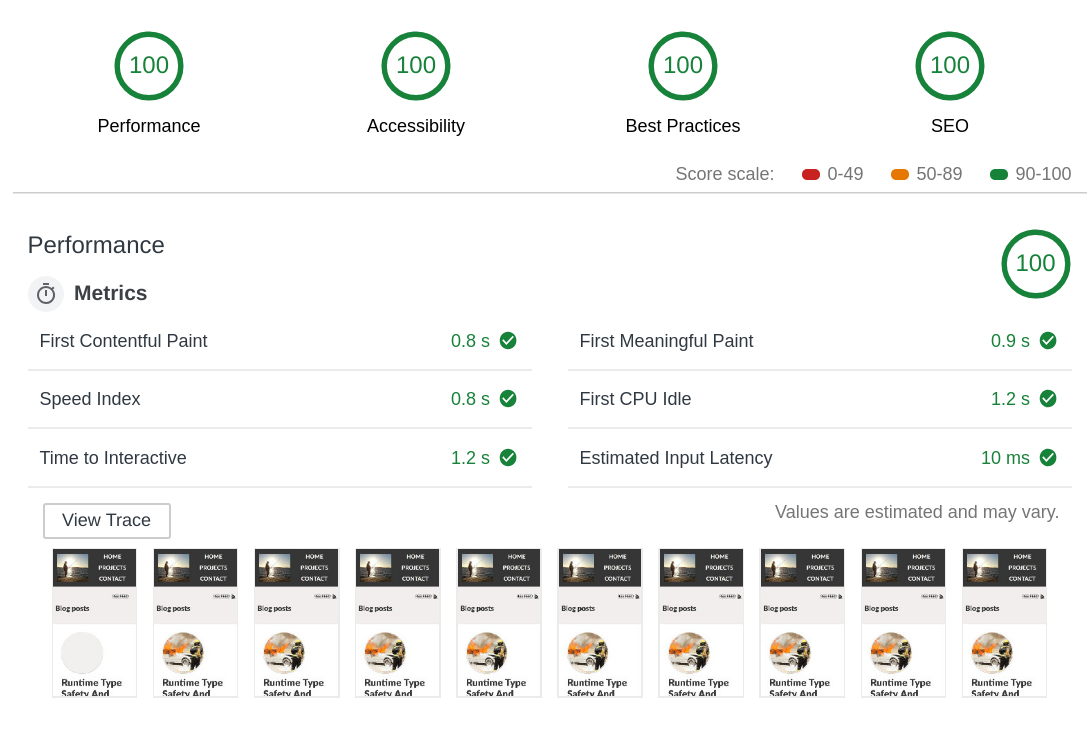
Lighthouse Results
The results of these optimizations as measured by Lighthouse can be in the screenshot below.
Here is a nice visualization that shows what the different metrics refer to.
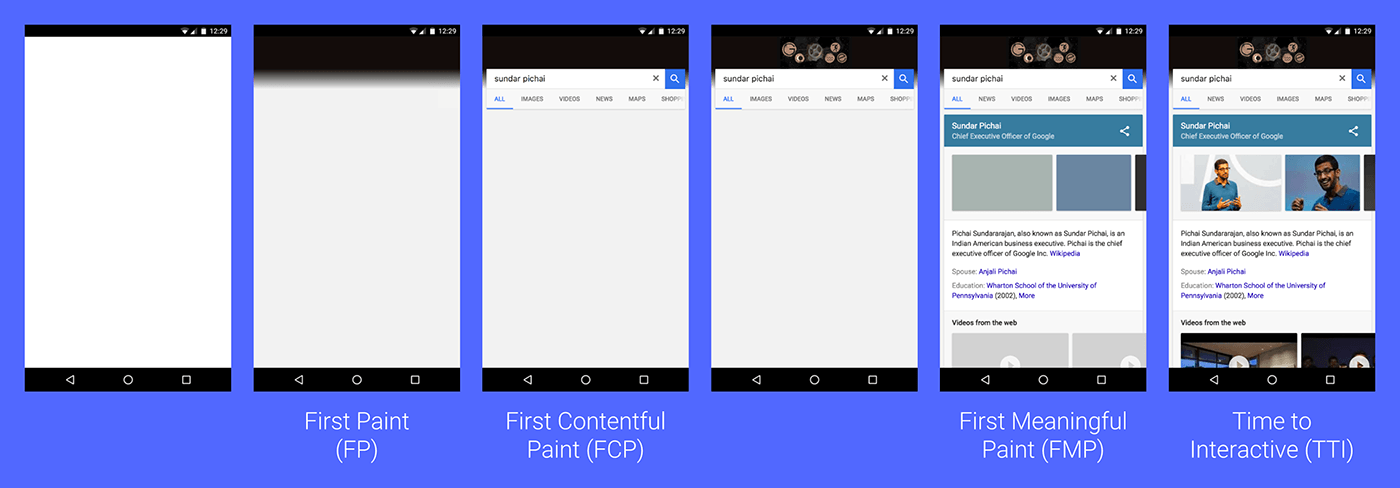
Image source: User-centric Performance Metrics.
As you can see from the lighthouse results, the First Contentful Paint and First Meaningful Paint are happening almost at the same moment. In fact, quite often Lighthouse reports same results for them when running the audit for my site. The Lighthouse results usually vary slightly between runs. What this result means, is that the as soon as the browser is able to render something, it is meaningful content instead of placeholder or empty content whenever it gets to starting rendering.
One important metric is the Time To Interactive.
For my site, Lighthouse reported it at 1.2s which is a very good result.
This is achieved by not having heavy JavaScript resources on the page.
WebPageTest Results
Another way to measure the performance is to run a few test on WebPageTest. It is an amazing (and free!) tool for performance audits.
Here, you can see a screenshot of the WPT results for my page on February 17, 2019.
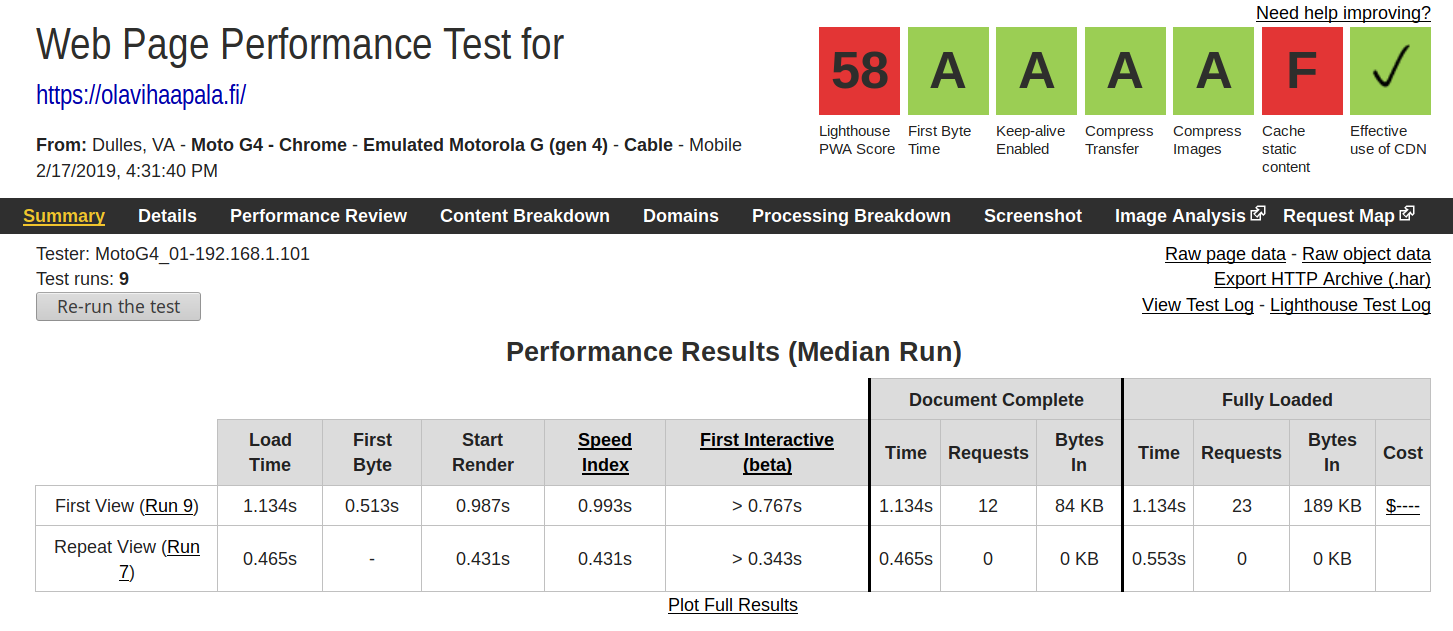
Link to the original results, where you can see more details.
The results from WPT look quite similar to the Lighthouse results, but for some reason the Lighthhouse score reported by WPT is not 100. I don’t know the reason for this.
Final Words
Remember, that performance is all about the user experience.
You users don’t care what framework you use for building your fancy website.
They honestly don’t care whether you use HTML + CSS + JS or CSS-IN-JS or whatever JS-JS-JS solutions.
The only thing your average users care about is the actual perceived performance and usability of the end result.
Figuring out the perceived performance is not a simple task and can not be automated. In order to get useful results, you may need to actually reach out to your users and interview them and see how they experience your site or your application.
Learn More
If you are interested in learning more about web performance, I have collected a list of links to useful resources on this topic. You can find the list in this repository on GitHub.